
Tags
Bank of England, Consumer price index, CPI, Government, Harmonised Index of Consumer Prices, Monetary Policy Committee, Office for National Statistics, Retail Price Index, rpi
Today we were given inflation figures of April which fell to 2.4% in April, according to the Office for National Statistics, down from 2.8% in March.
Lower petrol prices and air fares helped the consumer prices index (CPI) to fall for the first time since September 2012.
But what we don’t know from these figures are that food prices continued to rise as cold weather hit crop production
and more importantly the measure of CPI does not take into account real figures of inflation affecting the Lay person.
Well here is why the Government prefers CPI Figures:
What is CPI?
CPI forms the basis for the Government’s inflation target that the Bank of England’s Monetary Policy Committee is required to achieve.
It is an internationally comparable measure of inflation, published in the UK until December 2003 as the Harmonised Index of Consumer Prices (HICP).
Although the name has changed, the CPI and HICP remain one and the same index, calculated according to rules specified in a series of European Regulations.
What is RPI?
RPI is currenly used to index various prices and incomes including tax allowances, state benefits, pensions and index-linked gilts. Like CPI, it looks at the prices of items we spend money on, but it includes housing costs – such as council tax – and mortgage interest payments.
The Office for National Statistics announced in January 2013 that there would be no change to the method of calculating RPI, bringing relief to pensioners. But, the ONS did recommend a new inflation.
RPI Calculation
The United Kingdom RPI is constructed as follows:
A base year or starting point is chosen. This becomes the standard against which price changes are measured. A list of items bought by an average family is drawn up. This is facilitated by the Living Costs and Food Survey. A set of weights are calculated, showing the relative importance of the items in the average family budget – the greater the share of the average household bill, the greater the weight. The price of each item is multiplied by the weight, adjusting the item’s size in proportion to its importance.
The price of each item must be found in both the base year and the year of comparison (or month). This enables the percentage change to be calculated over the desired time period.In practice the comparison is made over shorter periods, and the weights are frequently reassessed. Detailed information is published on the Office for National Statistics website.
The following items are not included in the CPI: Council tax, mortgage interest payments, house depreciation, buildings insurance, ground rent, solar PV feed in tariffs and other house purchase cost such as estate agents’ and conveyancing fees.[12]
CPI is usually lower, though this is due more to the differences in the calculation formulas for the indices than to the differences in coverage. The UK Government announced in the June 2010 budget that CPI would be used in place of RPI for uprating of some benefits with effect from April 2011.[13]
Regarding State Pensions the UK Government confirmed in their autumn statement in 2011 that these would go up by the greater of the CPI, the RPI, or 2.5%. [7] The variability of the change in RPI is shown in the graph on the right. This was one of the arguments used in favour of changing to RPIX.

Calculating the CPI for a single item
Current item price ($) = (base year price) * (Current CPI) / (Base year CPI)
or\
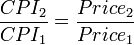
Where 1 is usually the comparison year and CPI1 is usually an index of 100.Alternatively, the CPI can be performed as

Calculating the CPI for multiple items
Many but not all price indices are weighted averages using weights that sum to 1 or 100.
Example: The prices of 95,000 items from 22,000 stores, and 35,000 rental units are added together and averaged. They are weighted this way: Housing: 41.4%, Food and Beverage: 17.4%, Transport: 17.0%, Medical Care: 6.9%, Other: 6.9%, Apparel: 6.0%, Entertainment: 4.4%. Taxes (43%) are not included in CPI computation.[3]
Related articles
- Rent Review: RPI, CPI and RPIJ (painsmith.co.uk)
- The Truth: Chained CPI Is Worse Than You Thought (economicpolicyjournal.com)
- Are inflation figures in the UK representative? (syesworldview.wordpress.com)
- The return of Inflation: how should business respond? (markgregoryeconomics.wordpress.com)
- Some good economic news: Inflation drop is bigger than expected (independent.co.uk)
- Falling petrol prices lead to bigger-than-expected drop in inflation in April (walesonline.co.uk)
- Will Early Retirement Become a Thing of the Past? (compareannuities.eu)
- Falling petrol prices help cut inflation (manchestereveningnews.co.uk)
- UK inflation rate falls to 2.4% (bbc.co.uk)
- Years of high inflation lie ahead (belfasttelegraph.co.uk)
